HTTP Connection Pooling in Go
by David Bacisin, published
When running Go services at scale—and those services have dependencies that they call over HTTP—then there may come a time when you need to start thinking about configuring your HTTP client transports to something other than the default. Since there isn’t much out there for clear guidelines on this subject, I hope this series starts to fill that gap!

Contents
- What is an HTTP connection pool?
- The Go standard library HTTP client
- HTTP/1.1 Connection Pooling
- HTTP/2 Connection Pooling
- Recap
What is an HTTP connection pool?
In short, a connection pool is a group of one or more open HTTP connections to a server. Connections that are not currently being used are considered idle. If TCP keepalive is enabled, then pings are sent and acknowledged periodically to prevent the intermediate network from closing the connection. An idle timeout automatically closes the connection if it continues to remain unused. After all, keeping a connection open indefinitely isn’t free.
When a client wants to communicate with a server, it first checks its connection pool. If an idle connection is available, it claims that connection so no other concurrent process can use it. Once finished, the client returns the connection to the pool for further reuse.
What if an idle connection isn’t available in the pool? This is one of several places where we can start to see performance problems under elevated load. Since connection pooling is implemented differently for HTTP/1.1 versus HTTP/2, we’ll discuss them separately.
For the curious reader, I’ve linked to the net/http source code for Go version
1.23.2 in many places. These links will be marked with an asterisk (*).
The Go standard library HTTP client
The basis of an HTTP client in Go is a http.RoundTripper,
which is implemented in the standard library as a http.Transport.
Whenever an application makes a call to client.Do (or Get, Post, etc), internally it calls
the RoundTrip method on the client’s transport. If this is the first time the client is connecting to the
server, then it will dial*
a new TCP connection and for HTTPS, negotiate TLS*. The Go TCP client tells the server that it supports HTTP/2, and if the server likewise supports HTTP/2,
then the connection is upgraded*.
HTTP/1.1 Connection Pooling
Because each HTTP/1.1 connection can only be used for one roundtrip at a time (and HTTP pipelining
has dismal support), the pooling mechanism is fairly
straightforward. The pool itself is a map with a key which describes the server host (of type connectMethodKey)
and a value which is a slice of idle open connections ([]*persistConn):
type connectMethodKey struct {
	proxy, scheme, addr string
	onlyH1              bool
}

type Transport struct {
    ...
    idleConn   map[connectMethodKey][]*persistConn // most recently used at end
    ...
}
The transport looks up the pool for the host and then
searches*
that slice for the most recently used connection that is still open—it’s possible that the server,
network, or operating system closed the connection while it was sitting idle in the pool. It then
removes the connection from the pool in order to complete the request. If a connection isn’t available,
then queueForIdleConn returns false. The default behavior then is to immediately
start dialing* a new
connection in a goroutine
and add a wantConn representing the request to a queue called
dialsInProgress*.
At small scale or fairly stable load, this default behavior is perfectly acceptable. However, if there’s a spike in outgoing HTTP requests—perhaps in direct response to a spike in incoming API requests or events—then this can cause significant connection churn when the request volume exceeds the size of the connection pool.
I’ve written a sample application with multiple examples to demonstrate the behavior of different HTTP client configurations in Go. Find it on my GitHub 👉 davidbacisin/golang-http-connections.
Example 1.1: Default HTTP/1.1 client
In example 1.1, I start 2 concurrent virtual users (VUs, to borrow terminology from the k6 load testing tool)
making requests as fast as possible to a local NGINX server for 20
seconds, followed by a period of 100 VUs for 20 seconds, and finishing with another stage of
2 VUs for 20 seconds. The server simply returns a static response to minimize roundtrip time.
The client is configured to match http.DefaultClient except that it intentionally disables HTTP/2.
Note how the spike in load causes a significant increase in connections dialed.
When dialing many new connections, the number of goroutines greatly exceeds the number of VUs because
each dial operation starts at least 4 goroutines, and each active connection maintains 2 goroutines.
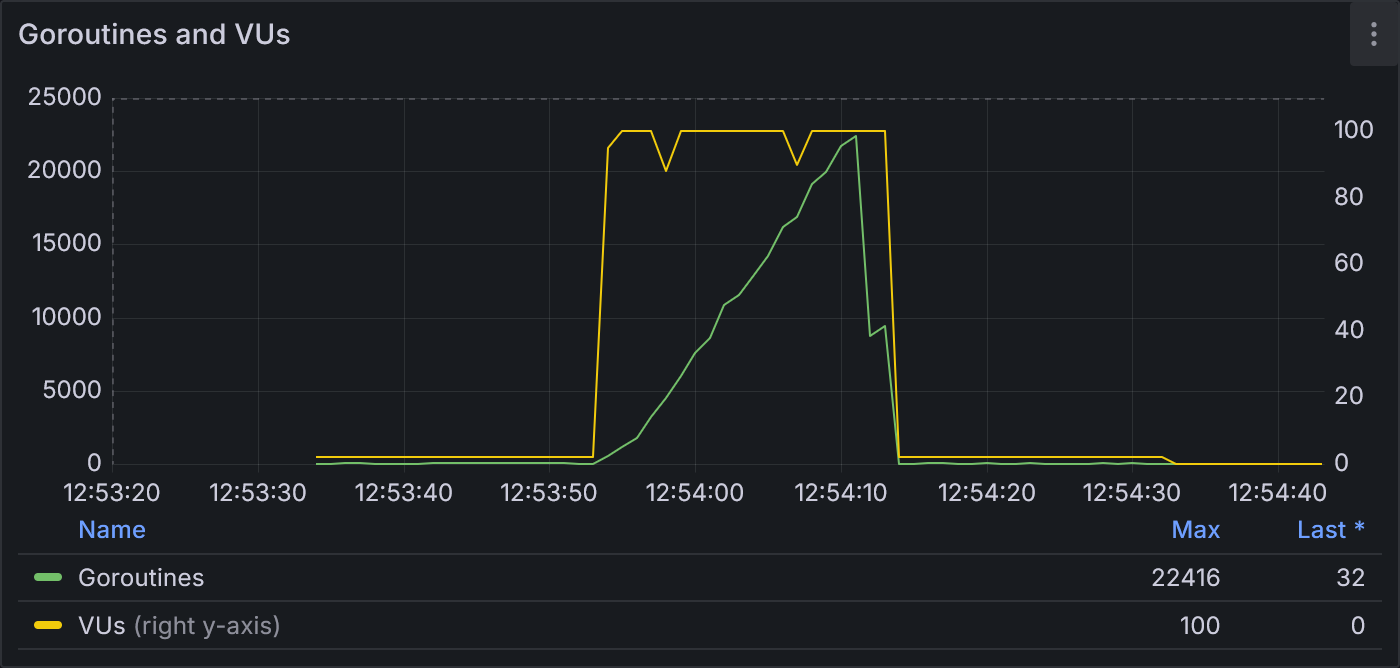
Example 1.1: Goroutines and VUs
The yellow line (right y-axis) is the number of VUs over time. It stays flat at 2 VUs for 20 seconds, then spikes to 100 VUs for 20 seconds, and returns to 2 VUs for the final 20 seconds. The green line (left y-axis) is the total number of goroutines. Goroutines start fairly flat, then steadily ramp up to 22,416 during the spike, until rapidly dropping back down to the baseline of about 32.
We see the request duration significantly increase once the period of 100 VUs begins. This increase in request duration is one of the primary issues that we’re hoping to mitigate.
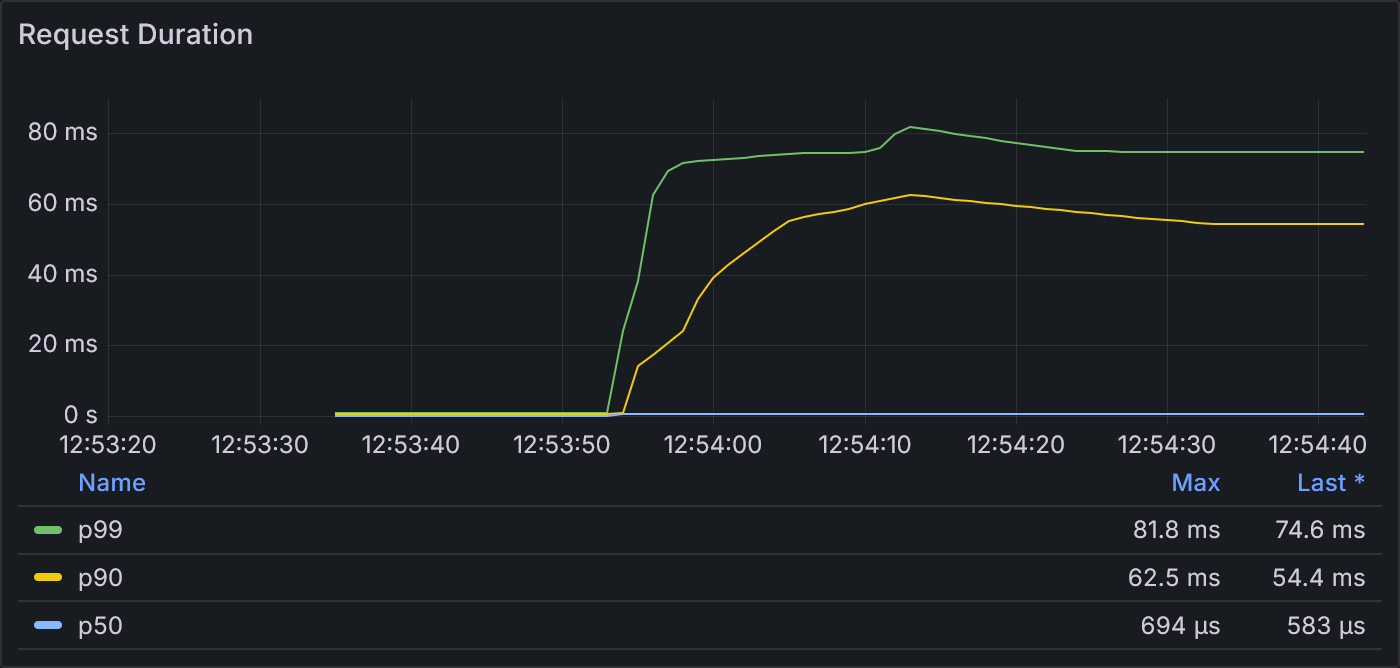
Example 1.1: Request Duration
These lines represent the 99th (green) and 90th (yellow) percentiles and median (blue) roundtrip times of the requests. The maximum p99 was 81.8 ms, and all durations spike dramatically as soon as the 100-VU stage begins.
In the next panel, the httptrace package shows how connections are reused. httptrace classifies
connections according to whether or not they were reused and whether or not they sat idle for a non-zero
amount of time. Some connections can be reused without ever spending time waiting in the idle pool
(reused=true, was_idle=false), and connections that are newly dialed are indicated by
reused=false.
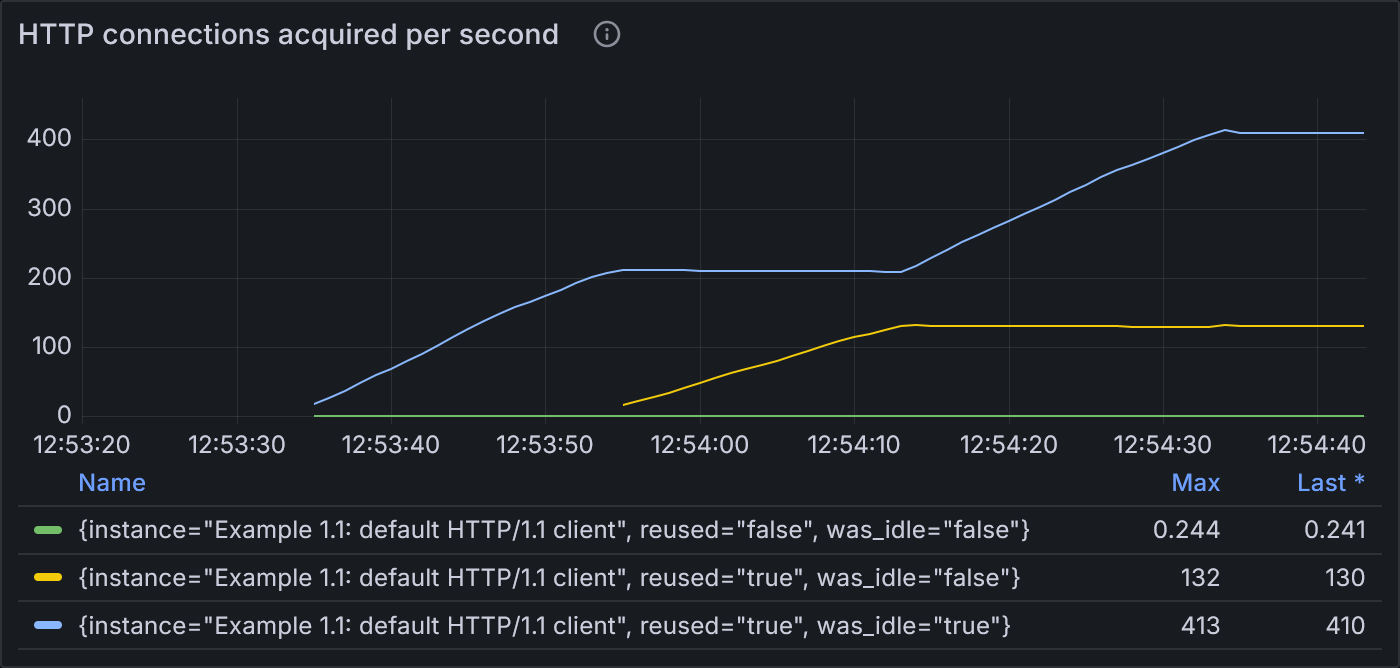
Example 1.1: States of HTTP connections acquired per second
The blue line (highest) shows that during both stages of 2 VUs, most of the requests are fulfilled by reusing existing idle connections. Shortly after the load spikes to 100 VUs, the blue line flattens and the yellow line (middle) ramps up, showing that most requests are fulfilled by reusing existing connections that were delivered directly to the incoming request without ever spending time in the idle pool. While hard to see, the green line (lowest) also spikes at the start of 100 VUs, indicating an increase in the number of new connections dialed.
Finally, net/http does not expose the size of a transport’s connection pool. Therefore, we run netstat in
the background periodically to confirm which connections
are actually observable in the operating system and provide an estimate for the size of the connection pool.
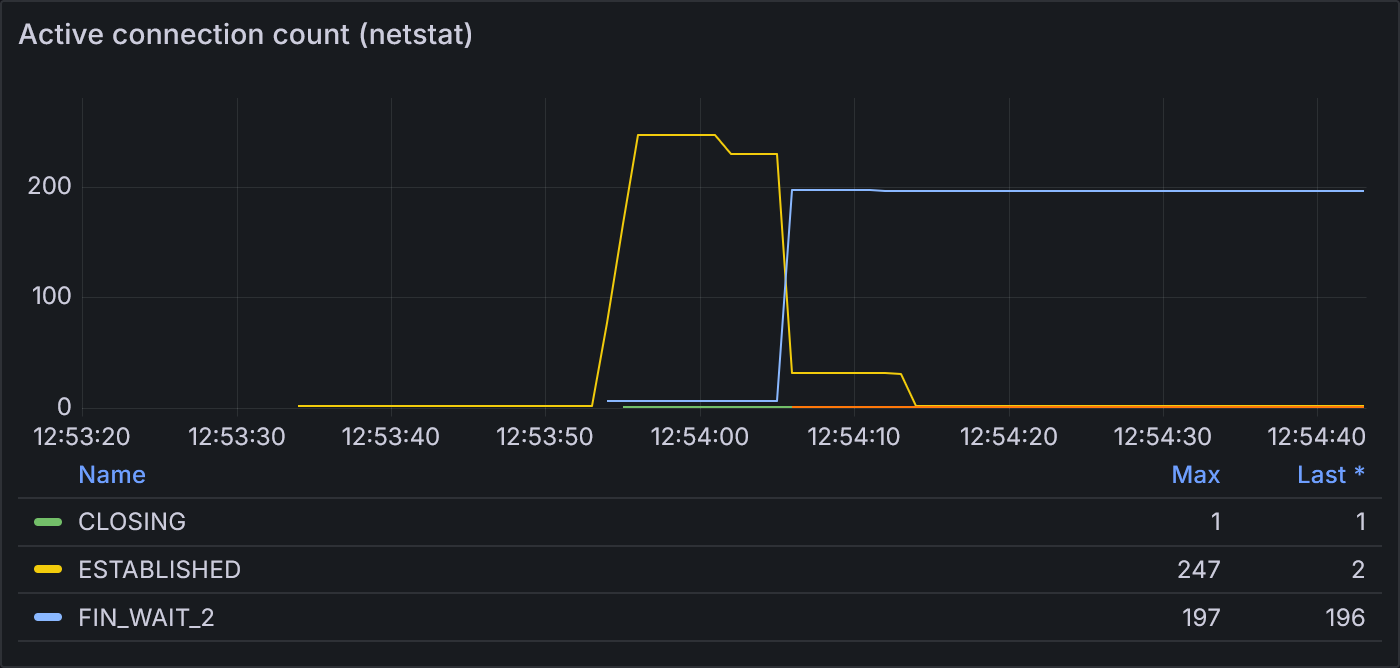
Example 1.1: Active connection count according to netstat
netstat shows that this test run spiked to 247 open connections at its peak.
Overall, this test run of example 1.1 completed 132,603 successful requests during its 60 seconds of execution time.
Example 1.2: HTTP/1.1 with a larger idle pool
To improve upon the default behavior, we first turn our attention to MaxIdleConnsPerHost, which
controls the number of idle connections allowed to be kept open per host. When zero,
the transport defaults to allowing 2 idle connections per host; if we increase this value to 100 in
our example, then we see dramatically improved behavior. In example 1.2, we run the same 3 stages of VUs.
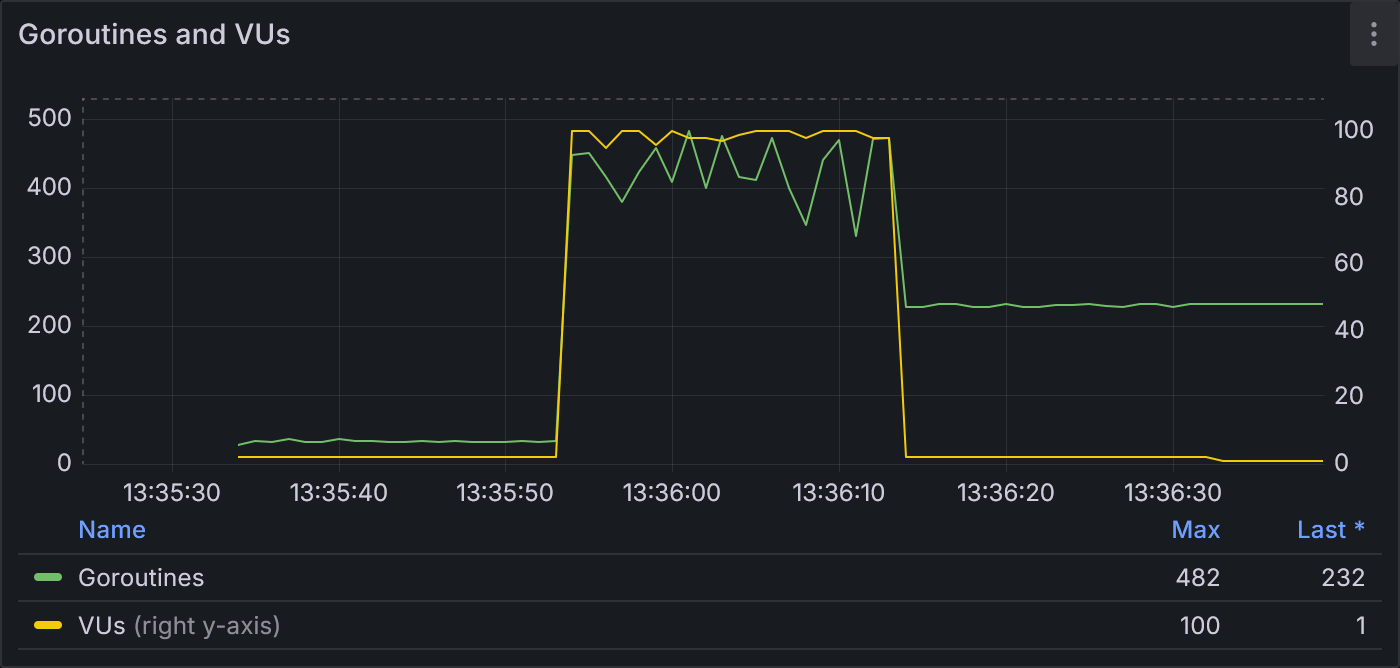
Example 1.2: Goroutines and VUs
With a much larger idle pool, we see fewer overall goroutines (peak of 482 compared to 22,416 from example 1.1) for the same number of VUs.
Note how there are many fewer goroutines—recall that the standard library uses multiple goroutines to dial new connections—and the request duration is significantly lower.
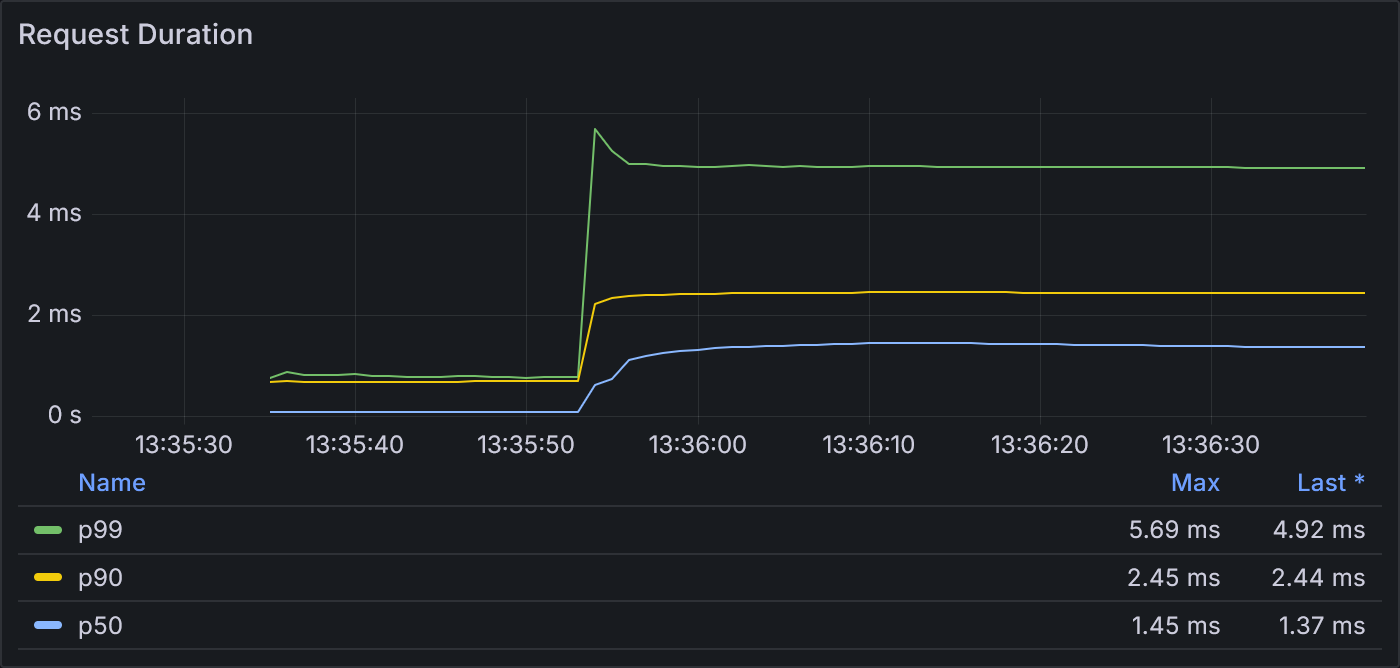
Example 1.2: Request Duration
With a much larger idle pool, the request latency is also improved, peaking at a p99 of 5.7 ms instead of 81.8 ms.
This performance improvement is explained by the connection pool.
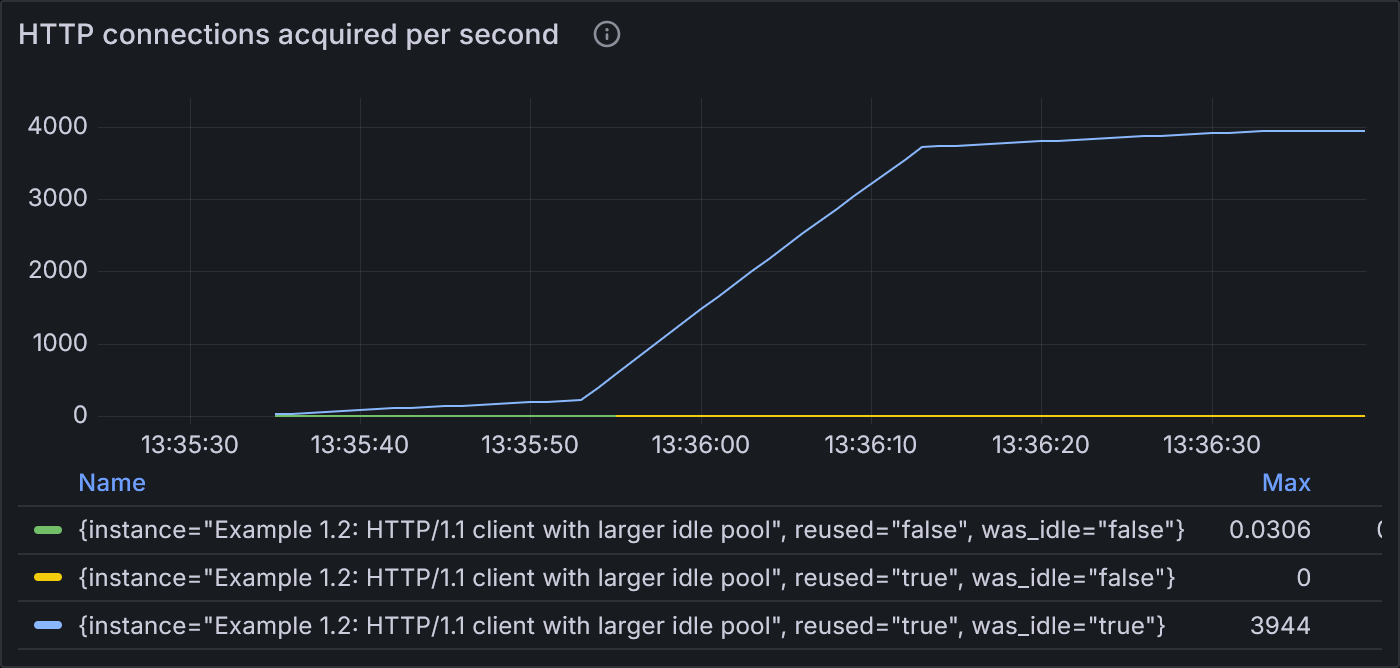
Example 1.2: States of HTTP connections acquired per second
The rate of new connections being opened is lower (max 0.03 conn/sec compared to 0.24) because the rate of reusing idle connections is significantly increased (max 3,944 conn/sec compared to 413)
netstat also shows a significant decrease in the number of connections,
matching the configured size of the idle pool.
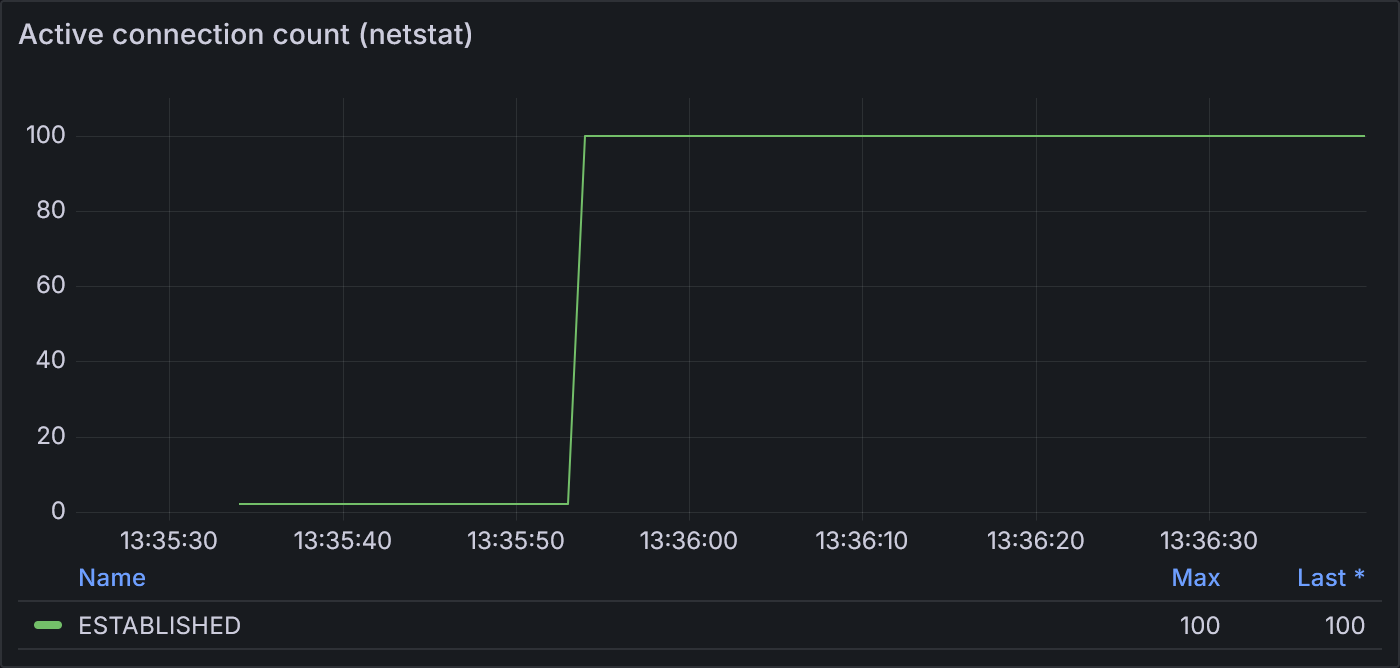
Example 1.2: Active connection count according to netstat
netstat shows a steady 100 connections open once the 100 VU stage begins. According to netstat,
those connections stay open even during the final cool-down stage. This makes sense because
the idle timeout is longer than 20 seconds, so no connection should be expected to close until
the idle timeout is reached.
Overall, this test run of example 1.2 completed 938,859 successful requests—a 7X improvement over example 1.1.
When load exceeds the idle pool
Even with a large idle pool, whenever the spike in requests is greater than the number of connections available in the pool, we’ll see a corresponding spike in dials. This is because an idle pool is only helpful to reuse connections that have already been opened. We see this in Example 1.2 as it transitions from 2 VUs to 100 VUs: the 2 open connections from the first stage are reused as it enters the second stage, but they are not nearly enough to fulfil the increase in load. While this scenario obviously happens shortly after application startup, it can also happen if a lull in traffic is long enough that older connections are closed due to the idle timeout.
This rush of dials is bad news for the downstream server as well, since it then has to negotiate and attempt to serve all of them. If it’s not scaled appropriately, resource contention results in some or all of those connections having latency that’s significantly higher than usual.
Recall that requests waiting for a dial operation are queued in dialsInProgress: so when the idle pool
is empty, this queue will hold the pending connection requests. When a dial completes and is successfully
delivered to the initiating request, then the wantConn waiting in dialsInProgress will be marked as
fulfilled. cleanFrontCanceled*
will later remove that wantConn from the queue.
What if an existing connection becomes available between the time a wantConn was added to dialsInProgress
but before its dial operation completes? As illustrated in the diagram below, the existing
connection is delivered to the pending wantConn request. Once the dialed connection establishes, it is
added directly to the idle pool without yet being used, as long as the pool hasn’t reached the
size limits MaxIdleConns or MaxIdleConnsPerHost. This optimization provides even more reason to
configure a larger idle pool: if adding the connection would cause the pool to exceed the size limits,
then that freshly-dialed connection will be closed without ever being used*.

While this is certainly a nice optimization, it doesn’t help us manage the traffic spike:
those 98 dials will still be performed. One way to manage those dials is through another configuration
option, MaxConnsPerHost.
Example 1.3: HTTP/1.1 with MaxConnsPerHost
MaxConnsPerHost imposes an overall limit on the number of connections—idle and active—that the
Transport can have open simultaneously for a particular host. For example 1.3, let’s consider a
Transport with the following settings:
http.Transport{
    MaxIdleConns:        10,
    MaxIdleConnsPerHost: 10,
    MaxConnsPerHost:     20,
    ...
}
Once again, we run our 3-stage load profile.
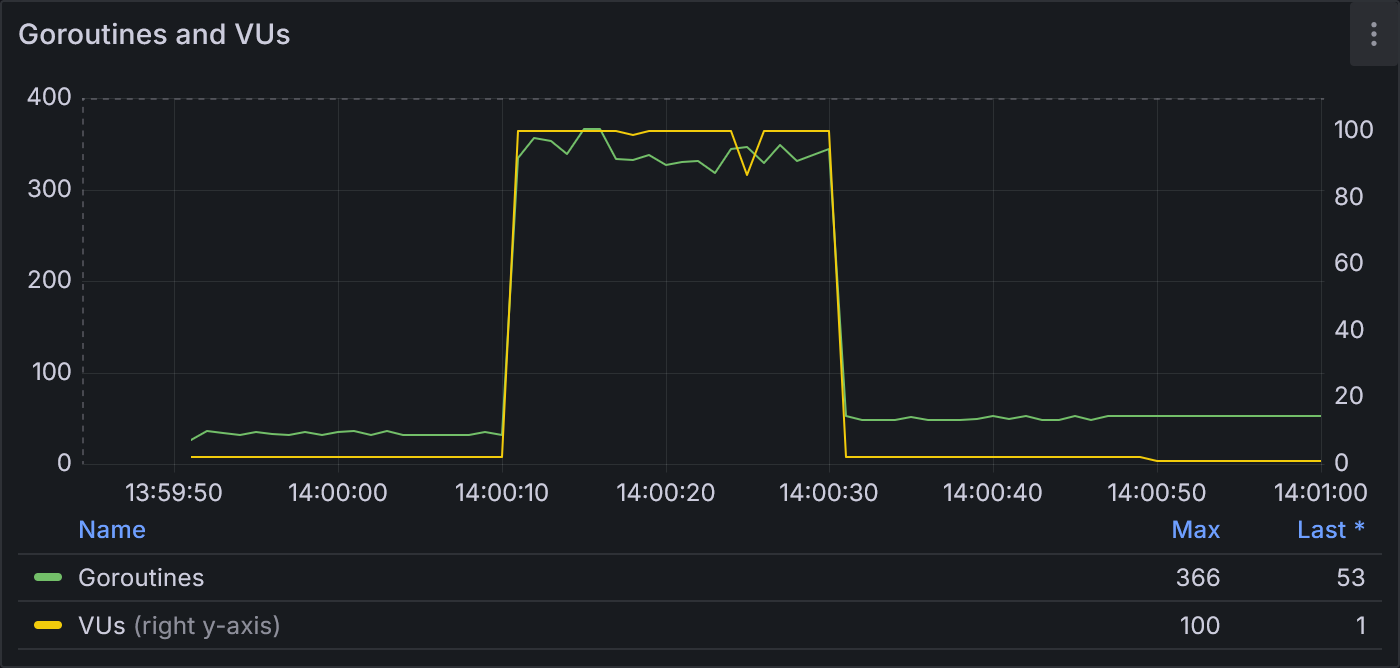
Example 1.3: Goroutines and VUs
With MaxConnsPerHost configured, we see slightly fewer goroutines (max of 366) than example 1.2.
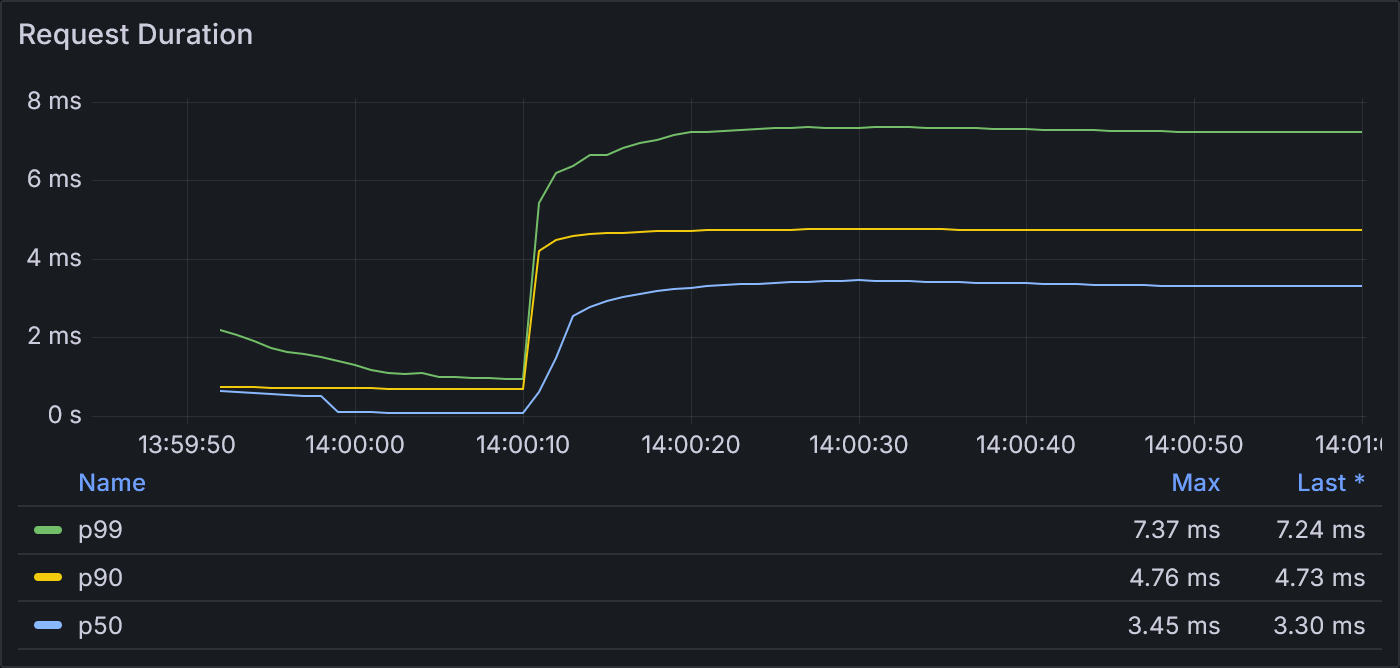
Example 1.3: Request Duration
Request duration is similar to example 1.2 (max p99 of 7.3 ms vs 5.7 ms).
The connection pool shows slightly different behavior. Like before, the vast majority of connections are reused. This time, however, because demand for connections greatly exceeds supply, many of them are reused without ever spending time idle. We also see even fewer new connections than example 1.2.
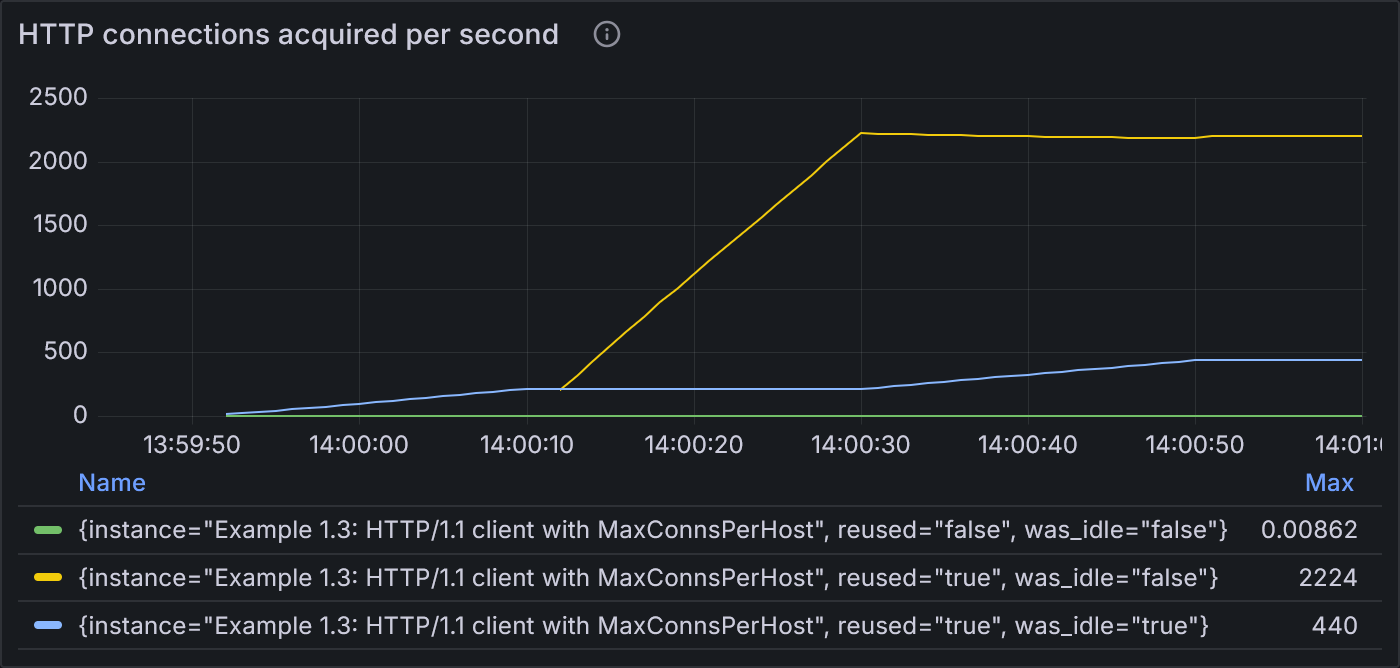
Example 1.3: States of HTTP connections acquired per second
Reused, idle connections (blue) fulfil most requests during the first stage of 2 VUs. Shortly into the second stage of 100 VUs, most connections are reused without ever sitting idle (yellow). This line increases until the end of the stage. Once load drops back down to 2 VUs, the demand for connections is low enough that they sit idle (blue line ramps up again).
At 2 VUs, we maintain 2 open connections to the target host. As we add a few more, new connections
are dialed immediately*. Once we hit 20 open connections to the host, however,
then the transport queues*
(FIFO) the request until there are connections available for reuse.
If an existing connection is closed (perhaps by the server), then decConnsPerHost will find the next
connection still waiting in the connsPerHostWait queue and dial a new connection for
it*.
Importantly, netstat shows that it never surpasses 20 active connections—so the configured setting
works as expected.
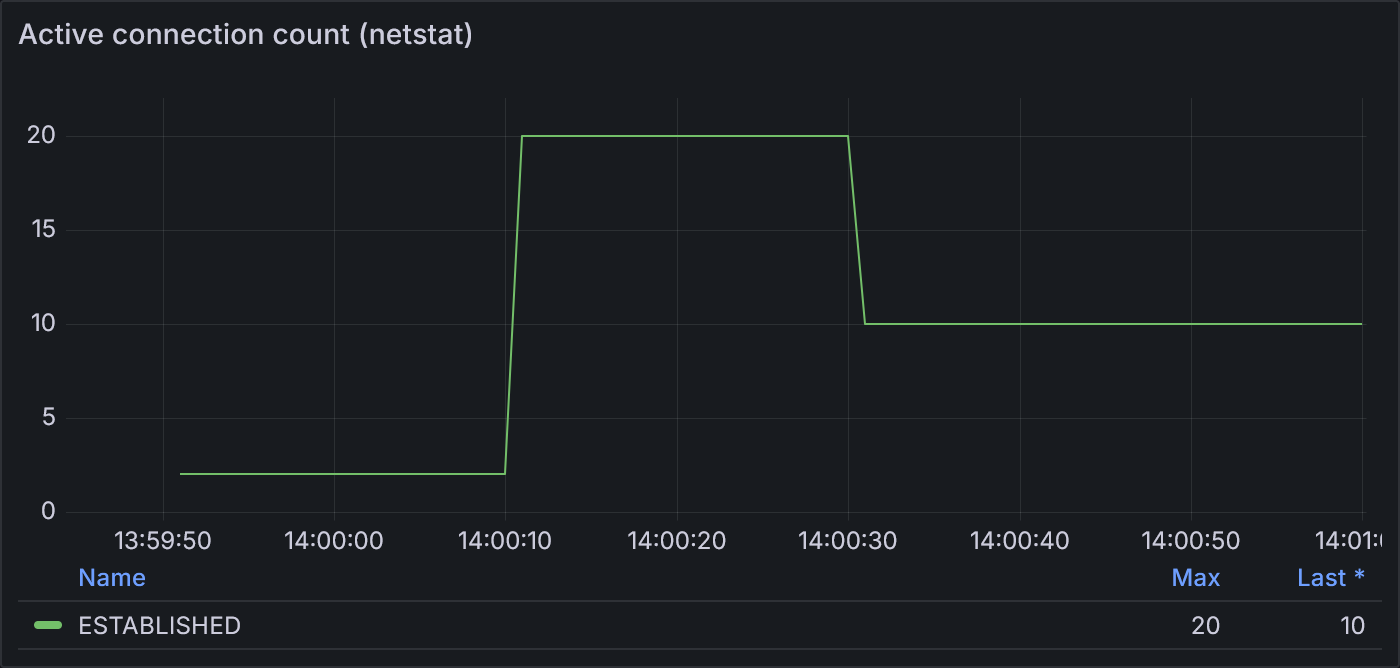
Example 1.3: Active connection count according to netstat
netstat shows 2 active connections initially, as expected for 2 VUs. At 100 VUs,
it reports 20 active connections: the configured limit. Returning to 2 VUs, netstat shows
10 connections to match the configured MaxIdleConnsPerHost.
Our netstat results demonstrate that MaxConnsPerHost
allows the client to open more connections than can be held by the idle pool, and once those extra
connections are no longer needed, the client closes those connections until it’s down to the allowed
idle pool size.
Overall, this test run of example 1.3 completed 648,713 successful requests.
Besides the potential for panics, MaxConnsPerHost is generally unappealing because it places a
hard upper bound on the number of connections the application can make to the downstream host.
If both the client and server applications have auto-scaling mechanisms, then this hard limit is unlikely to
utilize the full capacity of the system. Once the downstream server scales to handle the
increased load, then the client should be able to open more connections without impacting
roundtrip latency.
If we can’t use MaxConnsPerHost, then how else could we manage the dialing of new connections?
Unfortunately, http.Transport does not provide any other means to manage dialing behavior without
overriding the dialer itself.1
How could we spread out the spike just enough to favor reusing connections over dialing new ones without too much of an impact on roundtrip time? Fortunately, network congestion control at the TCP layer is fairly well-studied and continues to be an area of active research.2 Keep an eye out for a future post from me on how we can apply congestion control at the HTTP layer to improve client dialing behavior under high load.
HTTP/2 Connection Pooling
So far, we’ve only discussed connection pooling with Go’s HTTP/1.1 implementation. If you’re able to use HTTP/2, then it may provide a significant performance advantage for certain use cases.
Recall how I started the HTTP/1.1 section with, “each HTTP/1.1 connection can only be used for one roundtrip at a time.” In contrast, multiplexing in HTTP/2 allows the same connection to be used for multiple requests concurrently. Multiple requests can be sent on the same connection before any responses are received, and the responses can be received in any order. This can often provide a significant advantage over HTTP/1.1 when many small requests and responses are involved. Note that while multiplexing solves head-of-line blocking at the HTTP layer, HTTP/2 is still susceptible to head-of-line blocking at the TCP layer: that is, if a TCP packet is delayed or dropped, then all the requests multiplexed on that connection will be blocked! (HTTP/3 solves this by building upon QUIC and UDP instead of TCP.) Therefore, HTTP/2 may average slower per request than HTTP/1.1 if packet loss causes many requests to be blocked. With HTTP/1.1, head-of-line blocking is limited only to the request for the blocked connection. Consider experimenting with your use case to choose the most appropriate protocol version.
While the principles of connection pooling are the same for HTTP/2, because of multiplexing, the details are slightly more complicated.
In Go, HTTP/2 is implemented in a separate package, golang.org/x/net/http2, and then
bundled with the standard library to work transparently by default in net/http. This
bundled version relies on the HTTP/1.1 implementation to dial new
connections*
and then takes over those connections when the server supports upgrading to HTTP/2*.
(If you’re looking at the code, note how the http2noDialClientConnPool calls getClientConn with parameter dialOnMiss set to false.)
The HTTP/2 connection pool is implemented*
with type map[string][]*http2ClientConn,
where the map key is the remote address (host:port). When a new connection is needed, it
iterates through the remote’s pool (of type []*http2ClientConn) to see if the existing connection has
“streams” available. The HTTP/2 spec describes a stream succinctly: “A stream is an independent,
bidirectional sequence of frames exchanged between the client and server within an HTTP/2 connection”3. Ultimately, instead of a request
reserving an entire HTTP connection as in the case of HTTP/1.1, a single HTTP/2 request reserves
a single stream within a connection.
How many streams does a single connection support? This is determined by negotiation between the client and server. The Go client starts with a default of 100*, and will update the value to whatever the server provides through the HTTP/2 settings frame. If an existing connection has fewer streams in use than this negotiated maximum, then that connection could be used for a new request*. Streams are taken from the idle pool simply by incrementing the number of streams in use*, and returned to the idle pool by decrementing that same field*.
If the existing connection is fully saturated—i.e. all of its streams are in use—and StrictMaxConcurrentStreams
is false (the default), then an error http2ErrNoCachedConn bubbles up to the HTTP/1.1 roundTrip implementation. This connection
is then removed from the idle pool*
as it is no longer available for new requests. The HTTP/1.1 layer then retries the request, calling getConn again to dial a new
or retrieve a different idle connection*.
The new connection is expected to have streams available.
This behavior of opening a new connection when all streams are in use operates in a gray area of the specification: strictly speaking, if a server has
negotiated a maximum number of concurrent streams with a client, then shouldn’t the client never exceed that limit? That said, the
server is probably capable of accepting connections from other applications, so it’s not out of question to establish a new
connection ourselves. The standard library allows us to abide by the stricter definition by setting StrictMaxConcurrentStreams to true
on the HTTP/2 Transport. Because the strict definition is relatively
unintuitive and the HTTP/1.1 implementation does not have such a limit by default, this setting is opt-in so that the default settings of the
two implementations behave similarly4.
Let’s now look at some examples of HTTP/2 connection pooling in action.
Example 2.1: Default HTTP/2 client
In Example 2.1, we use the default settings from the bundled HTTP/2 implementation with the same stages from our tests with HTTP/1.1.
The target host is configured with 100 max concurrent streams, so we should see approximately 1 TCP connection in netstat per 100 VUs.
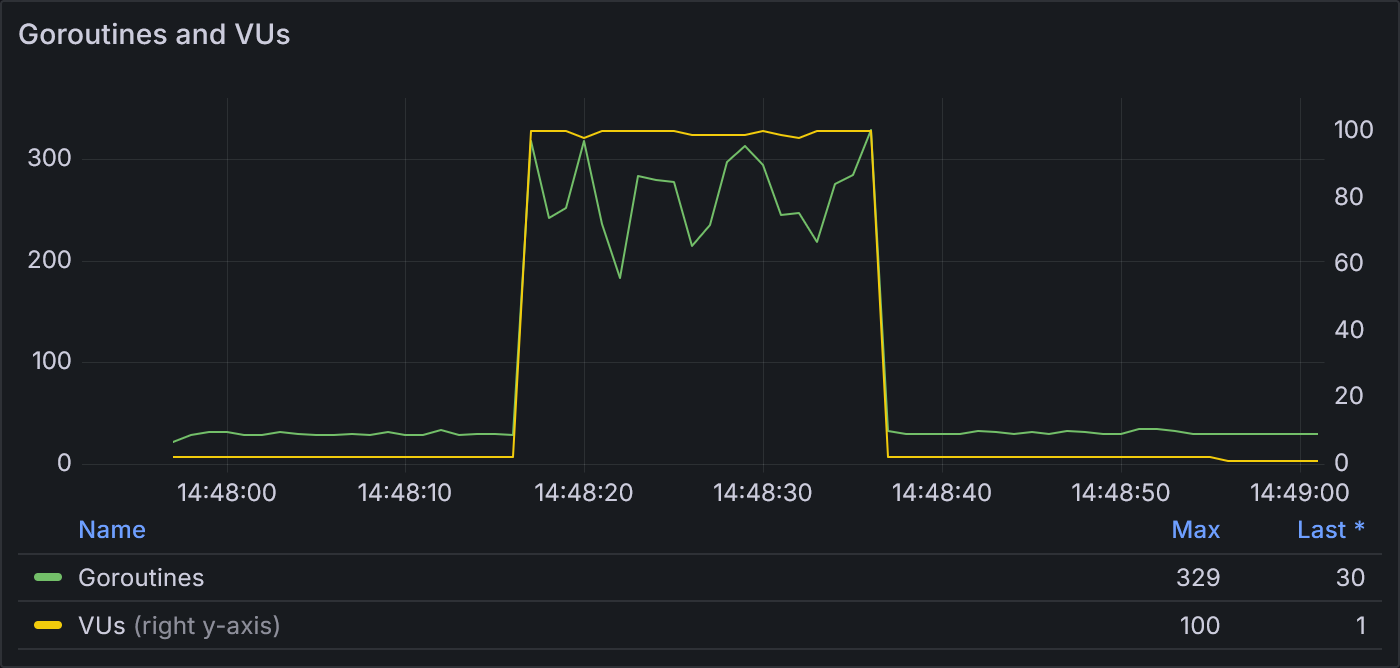
Example 2.1: Goroutines and VUs
The ratio of goroutines to VUs stays fairly low with an HTTP/2 client. At 100 VUs, the number of goroutines reaches a max of 329.
The lower overhead per individual HTTP/2 request allows the protocol to beat the roundtrip time of HTTP/1.1.
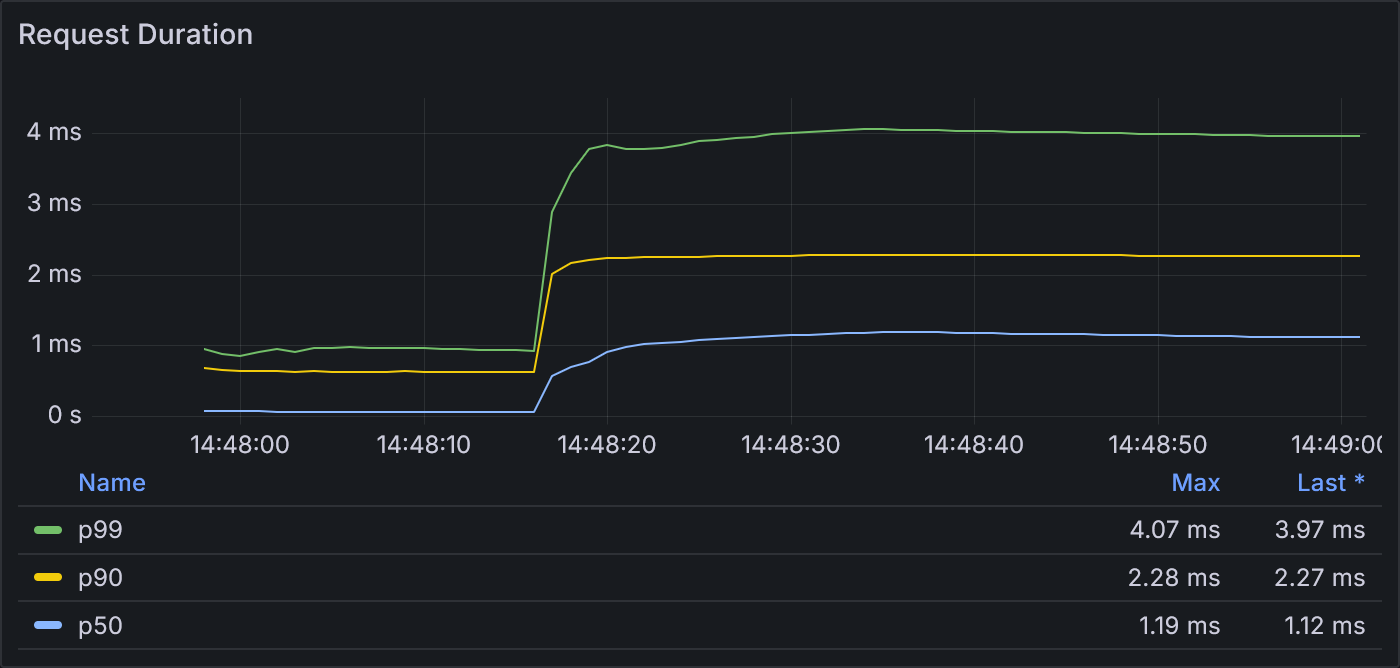
Example 2.1: Request Duration
The max p99 request duration in this test was 4.1 ms, compared to the 5.7 ms observed in example 1.2.
Multiplexed connections aren’t often idle, which is why httptrace shows the majority of reused connections as having was_idle=false.
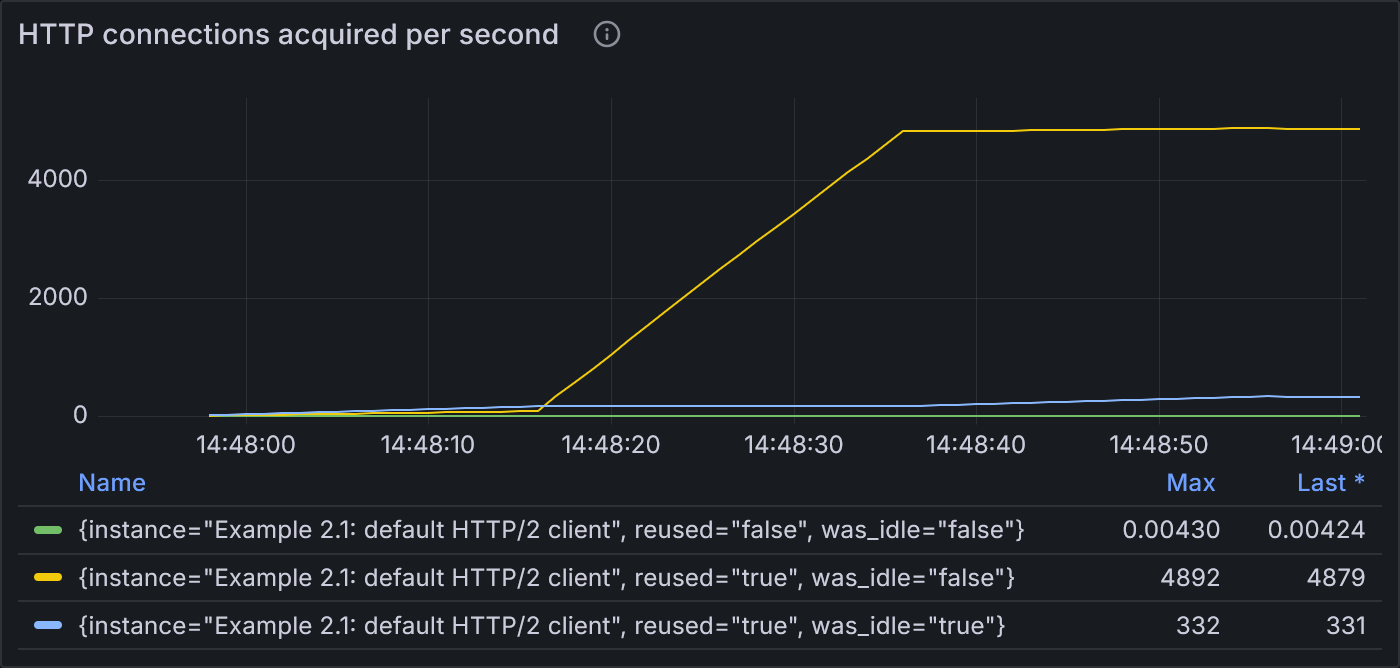
Example 2.1: States of HTTP connections acquired per second
The rate of reused, never-idle connections (yellow line) ramps up steadily during the 100-VU stage.
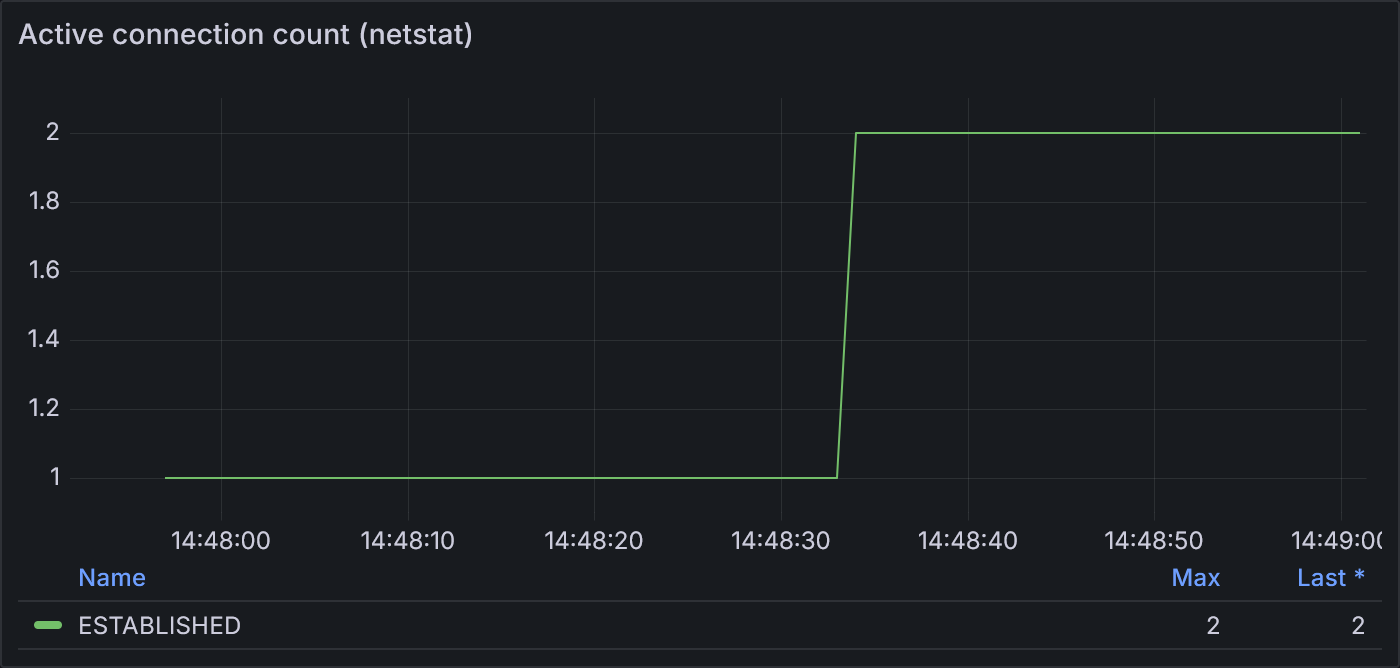
Example 2.1: Active connection count according to netstat
From netstat, we see that there are only ever 2 connections open at a time. HTTP/2 multiplexes the 100 VU requests
onto these 2 connections. The second connection isn’t opened until fairly late into the 100-VU stage, indicating that
while the one TCP connection could handle most of the increased load, the load was still high enough to trigger the
opening of a second connection.
Overall, this test run of example 2.1 completed 1,241,188 successful requests—32% more than our most performant HTTP/1.1 sample.
Example 2.2: Default HTTP/2 client with even more load
The default of 2 MaxIdleConnsPerHost makes more sense now that we understand that each HTTP/2 connection can actually handle
many concurrent connections at a time. However, with only 2 actual connections, it’s a little difficult to see how the spike in
VUs affects the system. With example 2.2, I’ve added a few more stages with even higher load: 20 seconds each at 100, 200, 300, and 400 VUs.
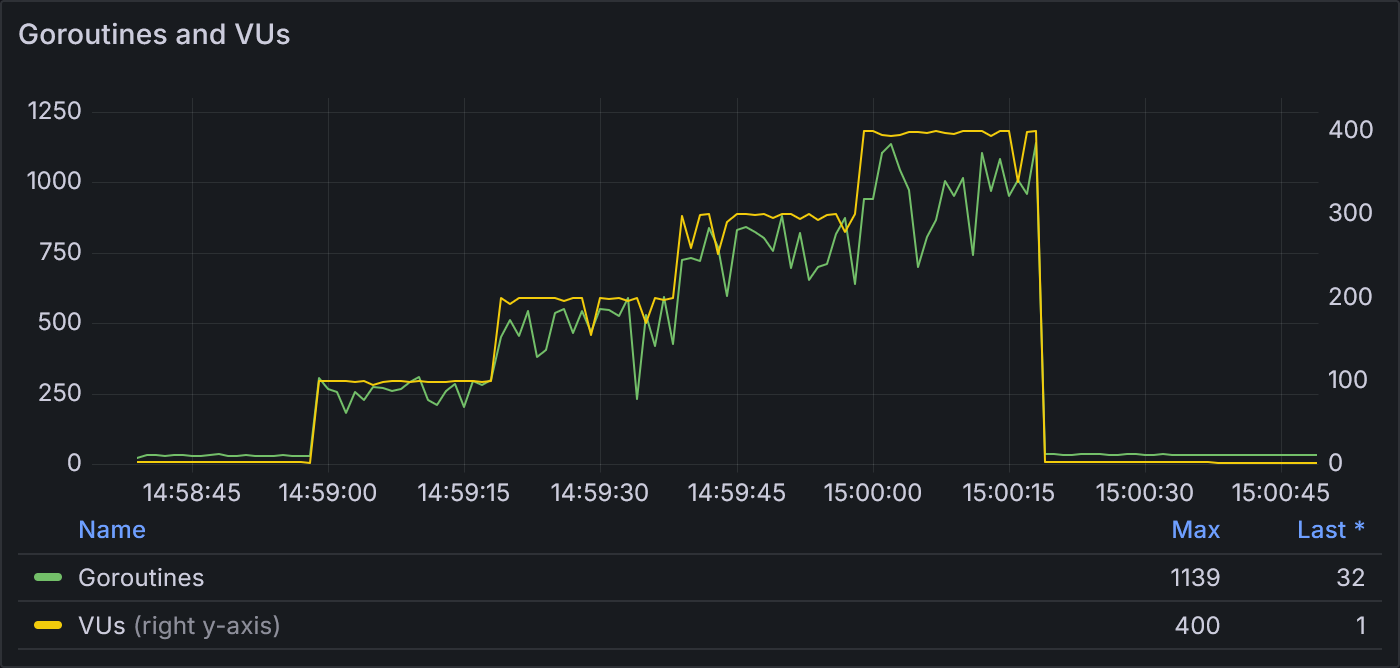
Example 2.2: Goroutines and VUs
Now with 6 stages, we see a stairstep increase in the number of goroutines corresponding closely to each stage in VUs. At 400 VUs, the goroutine count maxes out at 1139.
As the load increases, we see an increase in the request duration.
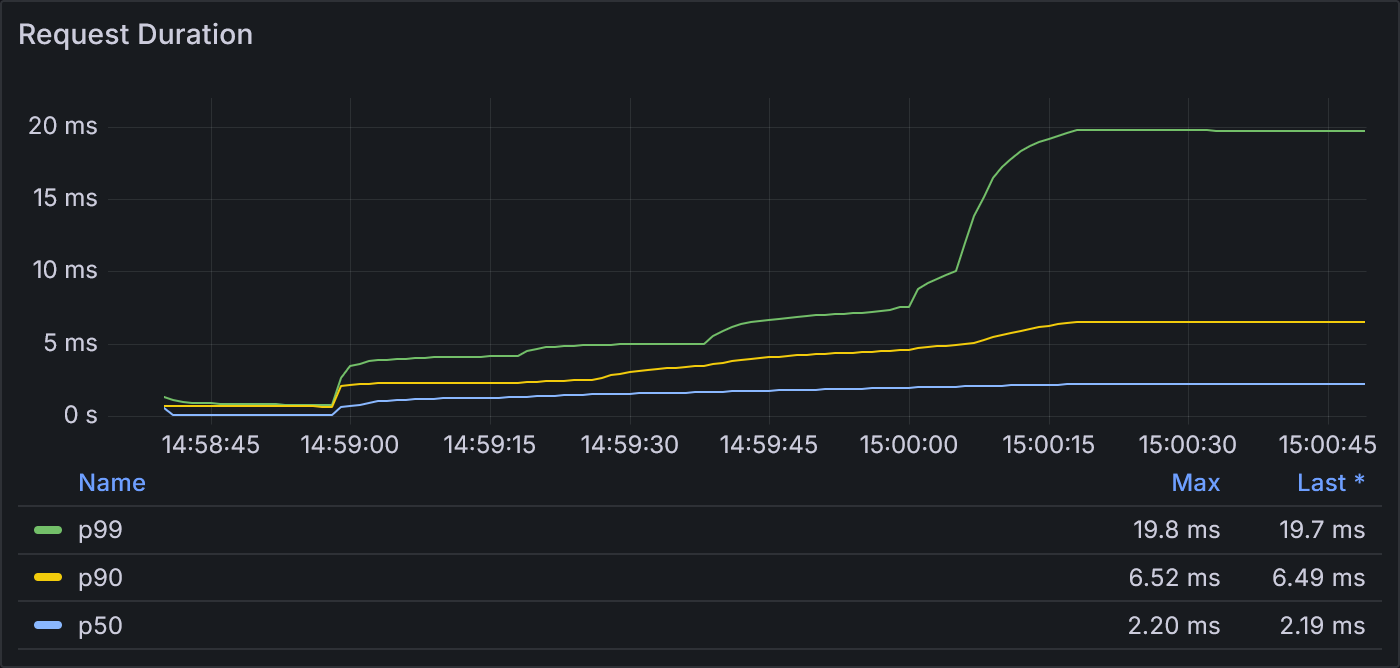
Example 2.2: Request Duration
The p99 request duration shows small increases at the start of each stage until reaching a maximum of 19.8 ms.
At higher load, we see a more extreme example of the connection reuse seen in example 2.1.
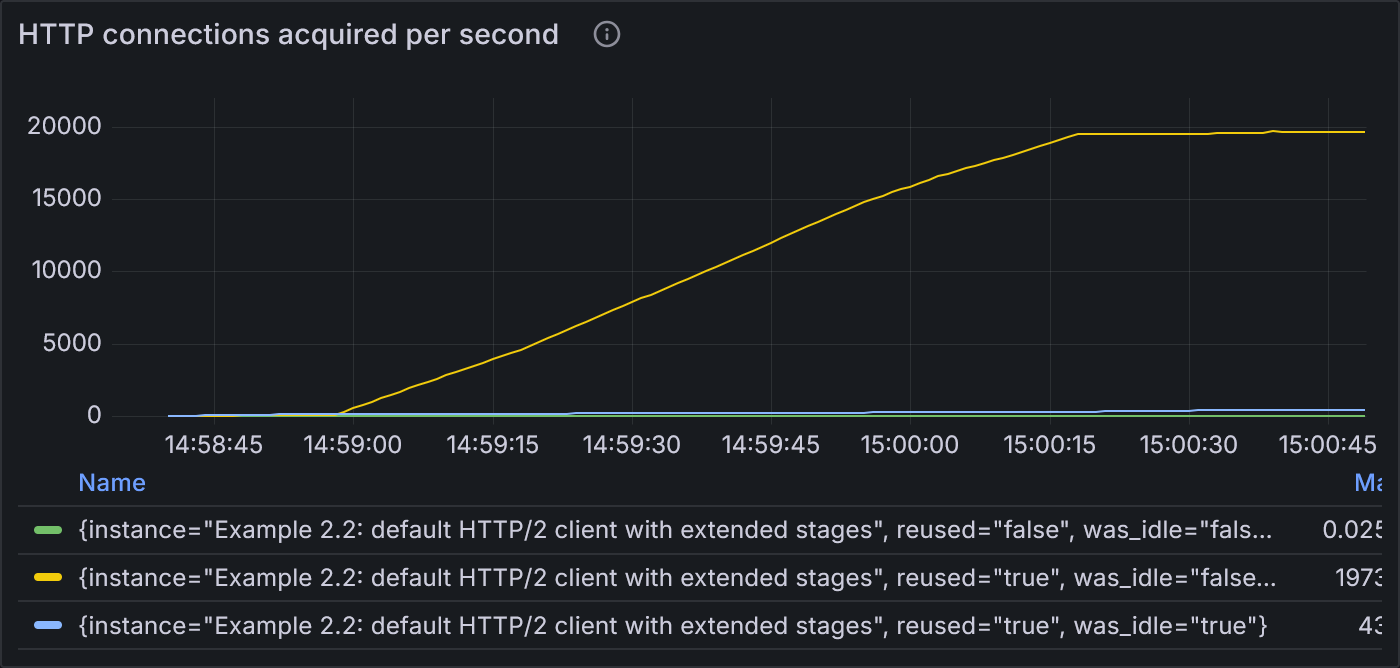
Example 2.2: States of HTTP connections acquired per second
The number of reused, non-idle connections (yellow) ramps steadily upward over the course of the middle 4 stages until flattening at the start of the final cooldown (2 VU) stage. The rate of opening new connections or even reusing idle connections is significantly lower.
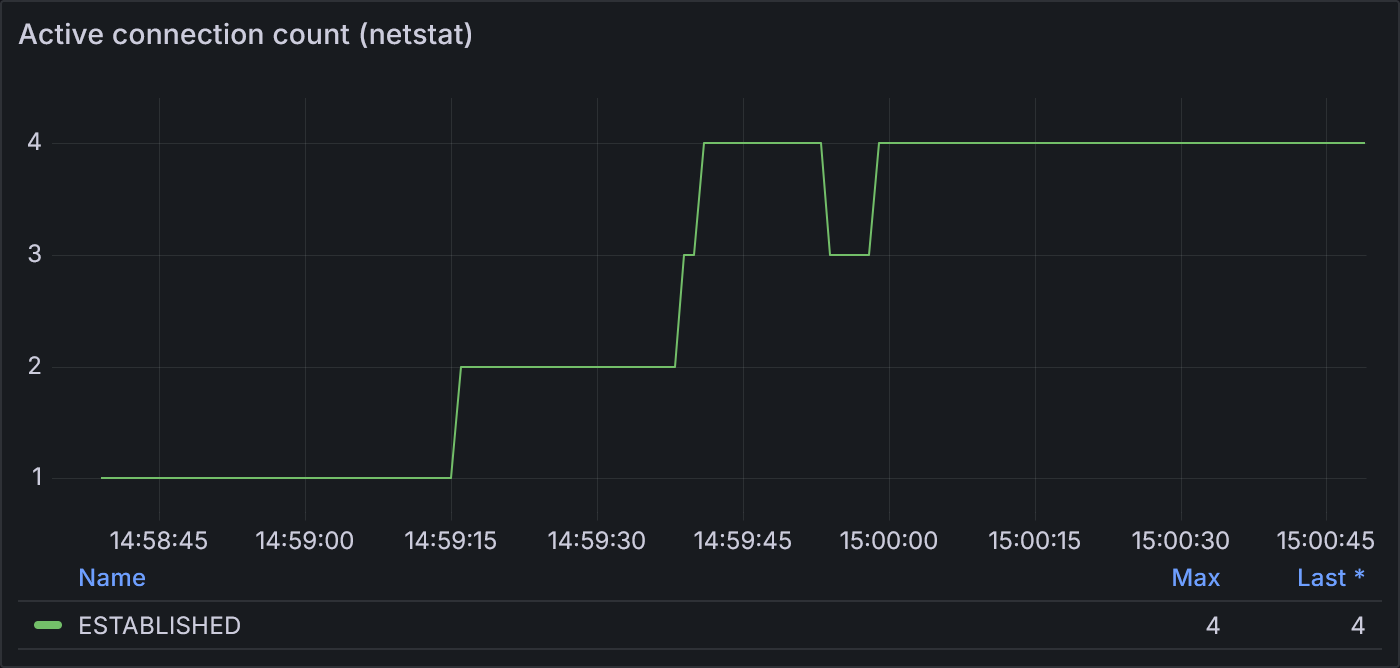
Example 2.2: Active connection count according to netstat
netstat shows a stairstep increase in the number of active connections, from 1 to 4, roughly corresponding to the increase
in load for each stage. As in example 2.1, new connections don’t align precisely with the start of each stage.
With 400 VUs and max concurrent streams at 100, it mathematically works out that our observed max through netstat
is 4 active connections.
Example 2.3: HTTP/2 client with StrictMaxConcurrentStreams
Finally, example 2.3 sets StrictMaxConcurrentStreams to true to show how this setting limits the client to exactly one
open HTTP connection per host.
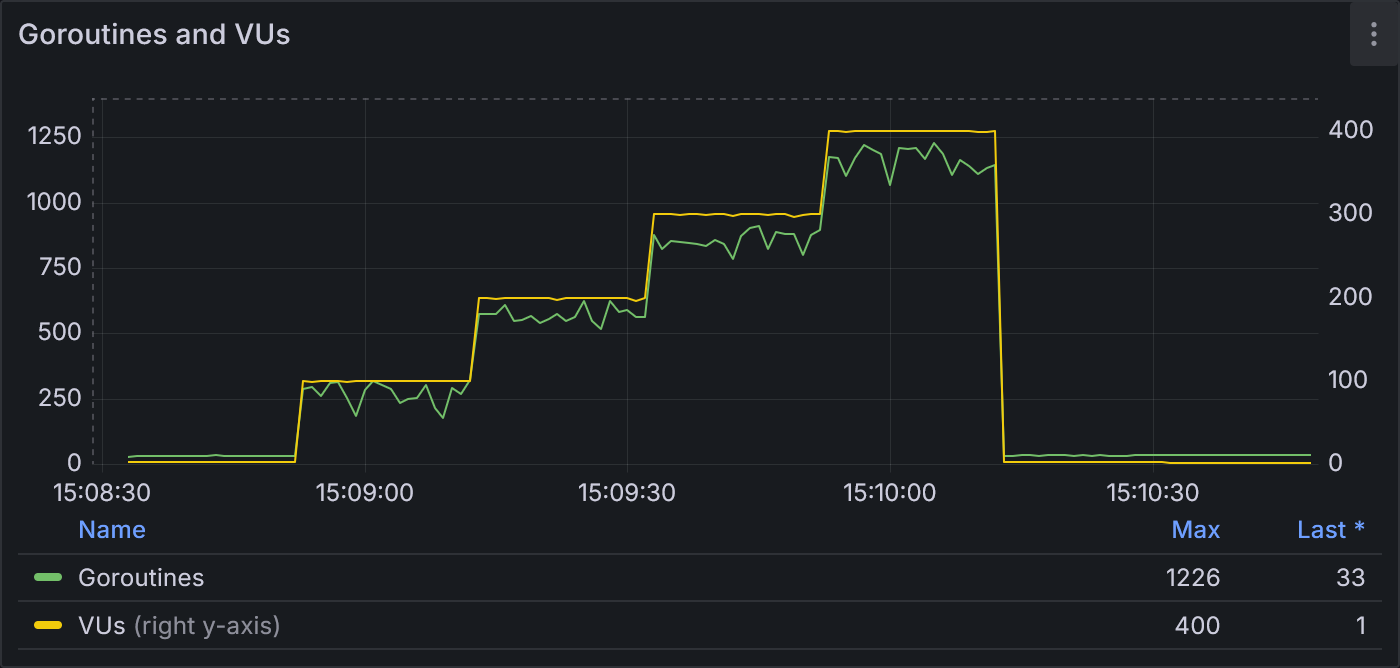
Example 2.3: Goroutines and VUs
As with example 2.2, the goroutine count follows the stairstep pattern of the VU stages. At 400 VUs, the goroutine count hits a maximum of 1226.
Because the connection is limited to 100 concurrent streams, the result is that each request queues until a stream is available. Thus the request duration increases as load increases.
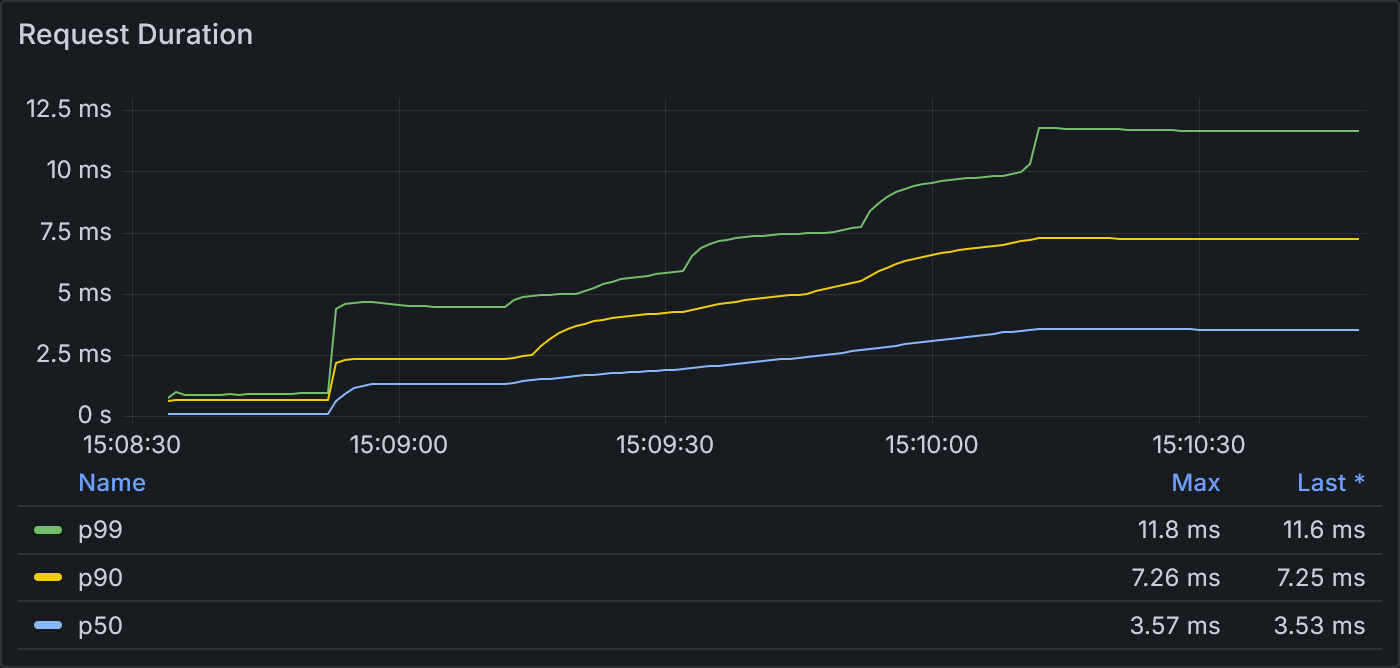
Example 2.3: Request Duration
At the start of each stage, the p99 request duration steps up a few more milliseconds until reaching a peak of 11.8 ms. These durations are similar in magnitude to those from example 2.2.
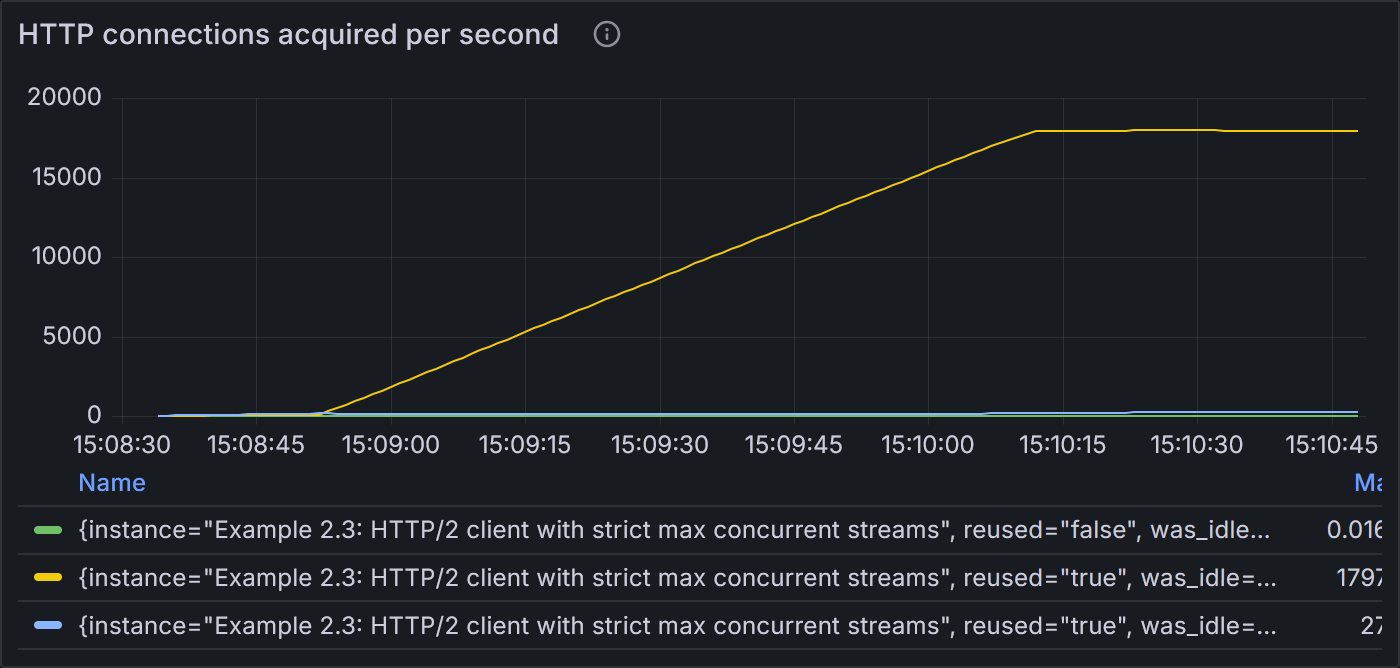
Example 2.3: States of HTTP connections acquired per second
Nearly identical to example 2.2, the vast majority of connections are reused and never idle.
With StrictMaxConcurrentStreams = true, even as the number of VUs increases to 200, 300, and 400, there is only ever
1 TCP connection to the server.
Recap
HTTP connection pooling in the Go standard library operates on basic principles and features several clever optimizations. Its default configuration can get you a long way, but at higher scale, its performance starts to break down. To summarize what we’ve learned above:
- Configure
Transport.MaxIdleConnsPerHostandTransport.MaxIdleConnsto relatively high values, such as 100 (or even 10,000!) to improve HTTP/1.1 performance. - Run tests to compare whether HTTP/1.1 or HTTP/2 provide better results for the payload size and network conditions. Head-of-line blocking in the TCP layer affects both protocol versions, but it can have a more severe impact on HTTP/2 due to multiplexing.
- Avoid using
Transport.MaxConnsPerHostuntil the panic is fixed, unless the pros outweigh the cons. If using HTTP/2, you can achieve a similar effect without the risk of panic by settingStrictMaxConcurrentStreams = true.
Questions or comments on this project? Start a discussion on GitHub!
Footnotes
-
For an example of overriding the dialer, see the sample application
TracingDialerandTracingConntypes: tracer.go#L57-L90 ↩ -
Serhat Aslan, Yuliang Li, Gautam Kumar, and Nandita Dukkipati. “Bolt: Sub-RTT Congestion Control for Ultra Low-Latency.” In 20th USENIX Symposium on Networked Systems Design and Implementation (NSDI 23), pages 219-236, Boston, MA, USA, April 2023. URL: https://www.usenix.org/system/files/nsdi23-arslan.pdf ↩
-
Hypertext Transfer Protocol Version 2 (HTTP/2), RFC 7540, May 2015. URL: https://httpwg.org/specs/rfc7540.html#StreamsLayer ↩
-
For a discussion of the default value for
StrictMaxConcurrentStreams, see https://github.com/golang/go/issues/27044. ↩