Empathy in the Human-Centered Design Process
by David Bacisin, published
For those who embrace human-centered design, the best results come from deep empathy toward users—but how does empathy actually affect the design process? For my undergraduate capstone research, I formulated and conducted an experiment to find out. While an ethnographic approach in a real design studio would be insightful, a controlled setting allowed me to observe how mindset and design tools each influence empathy.
With only 14 weeks to develop the experiment, revise to meet the ethics standards of the Internal Review Board, obtain funding, recruit participants, conduct the study, analyze the data, and prepare a paper and poster, I didn’t have much time—especially when balancing work and classes. With my schedule too tight for pilot testing, I needed a protocol that would minimize the effect of any one aspect of it being poorly designed.
Research Methods
I decided to create four separate design challenges, with each participant responding to all four. If one challenge were poorly written, the three others would provide better results as well as a baseline for comparison. If a participant had an unusual proclivity for one particular challenge, it would be unlikely that her expertise would give her an advantage in another challenge. The challenges were framed as being from four well-known consumer-facing brands so that participants could tap into their own knowledge of those brands.
Personae are popular tools for helping designers empathize with users, but a summary of survey results can often convey the same information. To see how personae affect empathy during the design process, I gave participants personae for two of their design challenges, and survey summaries for the other two.
Combining 2 types of user information documents with 4 design briefs—called a 2×4 counterbalanced mixed factorial design—I would be able to make many comparisons, including personae versus survey summaries and a single design brief versus the average of all four design briefs.

Empathy and decision-making are not straightforward to measure—we cannot
read thoughts. We can, however, ask people to speak their thoughts, which is
why previous studies of design thinking have had participants think aloud.
I also invited participants to use as much scratch paper as they desired, and I
asked them to create a single page document to summarize their design idea.
By videotaping them while they worked, I could connect their spoken words with
what was drawn on the paper.
Speaking aloud one’s inner thoughts while working does not come naturally to everyone, so I started all participants with a 10-minute practice session. I chose a river-crossing riddle which would require logical reasoning while keeping track of several objects. All participants wrote or drew on the scratch paper to help their thinking, and after the 10 minutes, everyone reported feeling comfortable with speaking aloud their reasoning process.
Measures of empathy range widely in terms of accuracy and timespan—while galvanic skin response may indicate emotional intensity within a range of a few seconds, it does not distinguish between empathy, stress, happiness, or anger. Perhaps the best way we can gauge empathic behavior is simply by asking, and many questionnaires have been created to evaluate empathy as a personality trait. I adapted one of these standardized scales, the Interpersonal Reactivity Index (IRI), to create the Situational Empathy Scale (SES) as a measure of empathy in the moment.
- Strongly
disagree - Disagree
- Somewhat
disagree - Neither
agree or
disagree - Somewhat
agree - Agree
- Strongly
agree
When developing such a metric, a researcher would generally test, revise, and develop standardized scores. Because of my limited time, I relied on the IRI’s three decades of vetting by keeping the 14 items of the SES as close in wording as possible to their counterparts from the IRI.
Putting it all together, each participant spent about 2 hours in the study. I welcomed, obtained formal consent, and guided all participants through the process.
| 10 min | Warm-up | |
| 30 min | 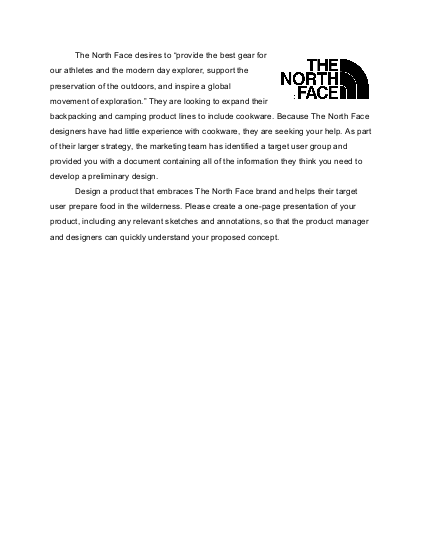
 |
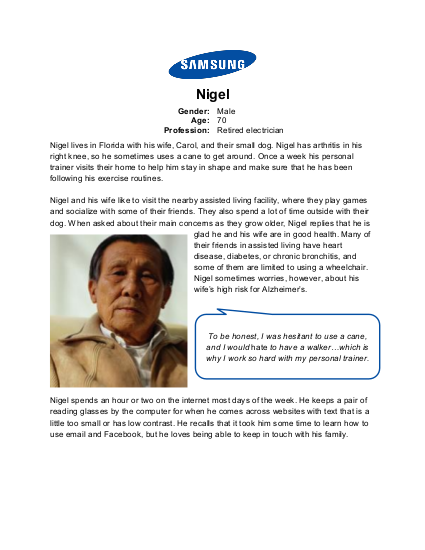
North Face persona |
| ~2 min | SES | |
| 30 min | 
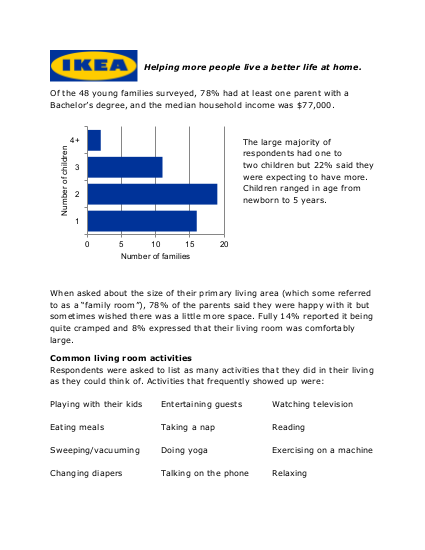 |
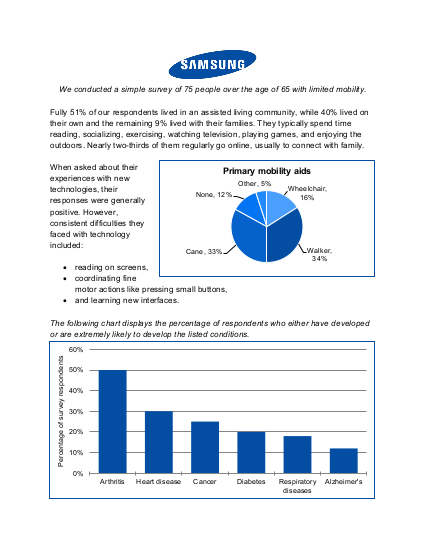
IKEA survey report |
| ~2 min | SES | |
| 30 min | 
|
Samsung persona |
| ~2 min | SES | |
| 30 min | 
 |
Pearson survey report |
| ~2 min | SES | |
| 5–10 min | Demographic questionnaire and debrief |
Recruitment and Funding
With the study designed and approved, I needed to find people willing to take two hours out of their day. To make that two hours a little easier, and with the knowledge that I could obtain a small grant, I decided to offer $15 Amazon gift cards.
I put out an advertisement in the university daily newsletter, and by my deadline for collecting data, I had 11 participants. Half were novice designers, without any formal training and instead using the problem-solving strategies of an average college student. Two had over 10 years of experience in design-related fields, while 3 had some amount of formal training and experience with design.
Results
Using multivariate statistical analysis, I looked at how the cognitive empathy and emotional empathy scores varied due to the document type and the design brief.
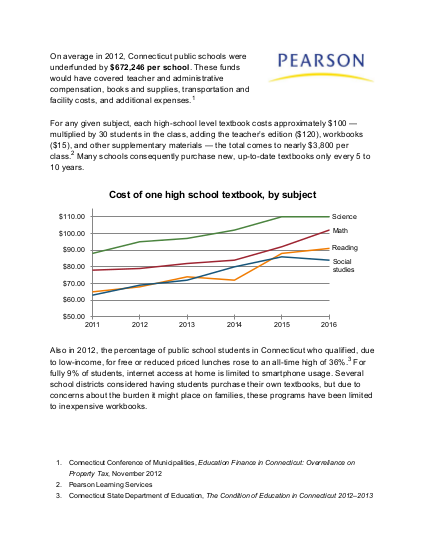
With the SES, I found that in general, designers tend to experience more emotions toward the persona than toward the people represented in the survey report. But that’s not always the case: the Pearson trials demonstrated that survey statistics also have the potential to engage strong emotional empathy. Many participants became visibly upset by the injustice of textbook prices and school funding as presented in the Pearson survey summary and persona, but on average, the Pearson survey summary evoked a greater emotional response than any other condition. Consequently, while personae may typically engage more emotional empathy, survey summaries can be compelling enough to meet or even exceed the effect of a comparable persona.

In terms of cognitive empathy, the story becomes more complicated. The North Face
and Samsung briefs showed no statistically significant difference between the cognitive
empathy subscores of the SES, while the IKEA and Pearson briefs showed opposite
results from each other: the IKEA persona evoked more cognitive empathy than its survey summary
counterpart, but the Pearson survey summary evoked more cognitive empathy than its
persona counterpart. This lack of a clear trend suggests that participants had
similar rational responses to both survey summaries and personae: the logical
part of their thinking process was not influenced by how the information was presented.
The observed variation in cognitive empathy is likely due to the fact that even rational
human reasoning is subject to many implicit biases.

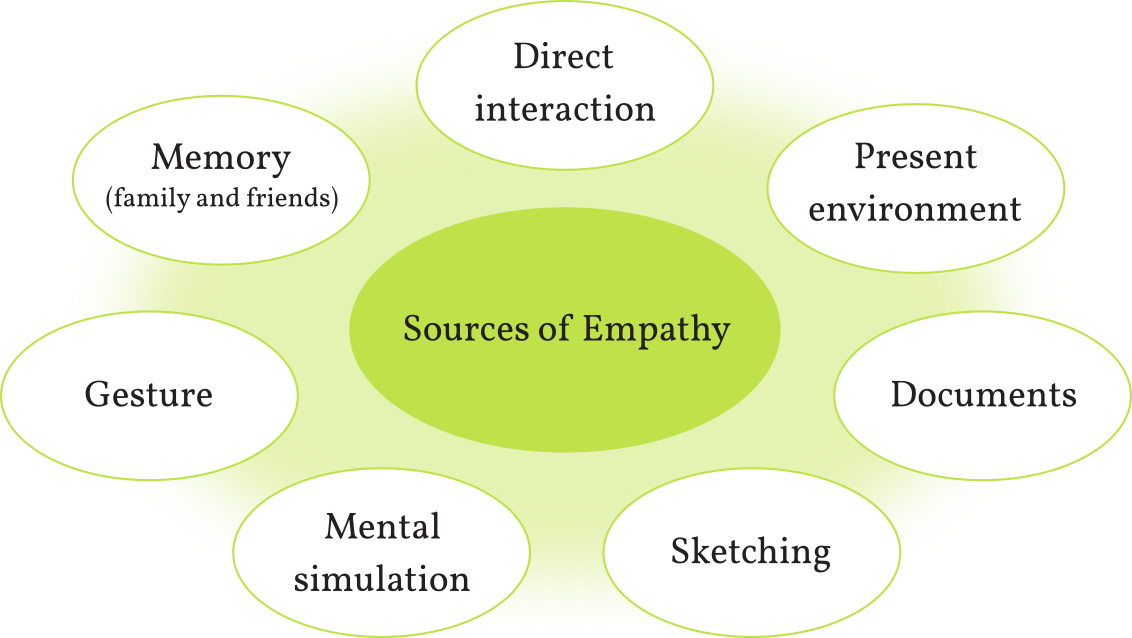
By listening to the designers think aloud, I observed many sources of empathy, several of which have not been previously considered in academic literature. Most notably, 8 of the 11 designers used gesture to understand how a user would interact with a product—such as grabbing and tapping their wrists to imagine a wearable device. While designers have used bodystorming and role-playing to simulate the experience of a possible solution, academia has not clearly identified bodily techniques as a form of empathy.
My careful combination of a think-aloud protocol with a numerical measure of empathy allowed for both qualitative and quantitative analysis, enabling deeper exploration of the multitude of data. The factorial design provided key comparisons across conditions and showed that the stimulus materials themselves (Pearson) could contradict the trends observed in other conditions. Crucially, my work fills a gap in current knowledge of empathy in design, and it lays the groundwork for future investigation.
While the designers ranged widely in their years of experience, my study did not investigate how experience affected the quality of the design outcomes, and more relevantly, how experience affected empathy. Future work would do well to understand how empathy affects the quality of the outcomes.